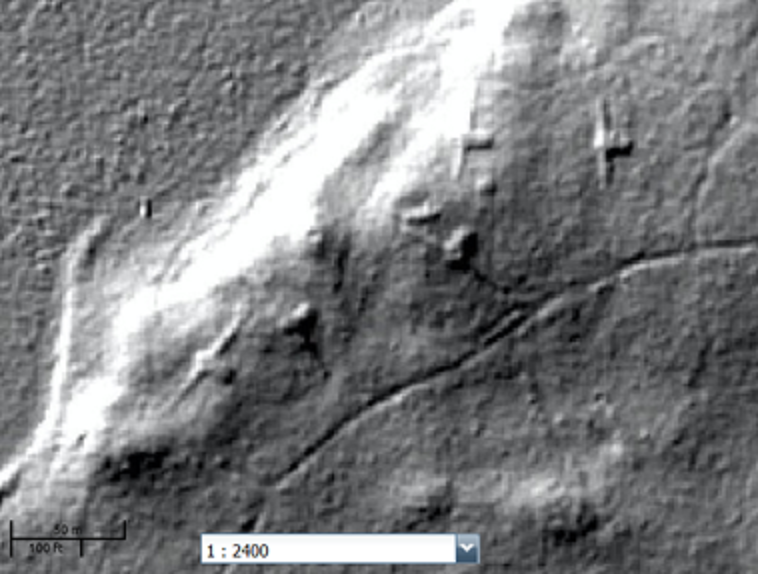
Understanding 2-D imagesShadows and light can provide visual cues that a surface is not flat. When we look at photos of mounds, it can be difficult to notice changes in height. Lidar images compile data from satellites to create a clear image of what is on the ground. The vegetation is stripped away and all that is left is the surface.
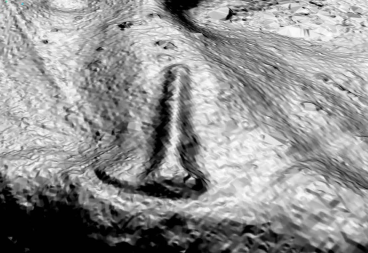
This lidar image uses hillshade to show the changes in Earth’s surface. If you look closely, you can see bird shaped mounds on the surface. The clarity of the image depends on the data used. An enhanced lidar image is easier to interpret.
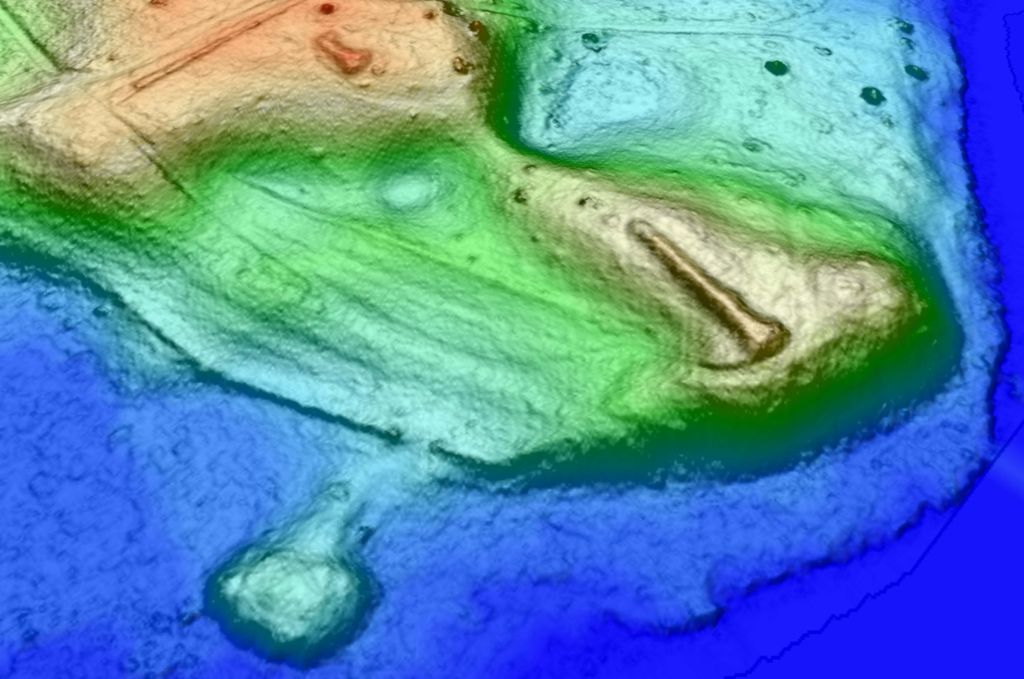
If color is added to suggest height, the image is even easier to understand. Images like these can help us understand the topography of Indian mounds. Topography describes the features of an area of land. It includes changes in elevation such as mountains, hills and valleys. It also includes bodies of water like lakes and rivers.
Without something to tell us how high each ring is, we can’t know what the topography is really like. Color can help us understand topography if we have a scale to tell us how high each level is. Without a scale, you wouldn’t know if
Activity: Drawing Contour Lines
Question: Have you seen patterns of concentric rings anywhere else?
Topographic Maps
Augmented RealityTopographic maps can be difficult to read if you aren’t familiar with how contour lines are used. When the lines are not adequately labeled, it is hard to tell whether an area is higher or lower than the one next to it. The black and white image of contour lines is difficult to read. The photo of the sand and the colored images next to it can help you interpret the contour lines in the black and white image.
The colored images were made using augmented reality (AR). A 3-D camera took an image of the sand. A computer program interpreted the data and made a color image of the topography. The AR Sandbox projected the colored image on the sand. When using an AR Sandbox, the way the sand feels, plus the color and the contour lines help the user interpret the topography of the sand. Topographic maps are can be much more challenging to interpret than photographs, lidar images, 3-D models, or augmented reality. Instead of using visual cues like shadow and light, these maps use contour lines to show relief. In geography, the term relief refers to the difference between the highest and lowest elevations in an area. A cartographer is a person who makes maps. Sometimes cartographers use numbers to represent the elevation above sea level. Elevation numbers can represent meters or feet. Sometimes color is used to help viewers understand elevation shown on a topographic map. Other times, cartographers use both. If you want to know whether the map is using meters or feet or another measurement, the scale should be written in the map’s legend. A map legend is a text box that contains information about the map. It labels all the symbols used in the map. If elevation is shown as a range of colors, those colors will be shown in order from highest to lowest. If a standard measurement is used, it will be listed. If the proportion is known, it can be written or illustrated the on the map. Color does not always represent height. Sometimes color is used to represent a specific feature. Features like lakes, rivers, parks, city boundaries, buildings, highways, streets, and paths can be represented by color or a pattern. Whenever a symbol, color, or pattern is used to represent something, it should be listed in the legend. A map legend can answer basic questions like:
Activity: Looking at Topographic MapsYou can check out a variety of topographic maps through the U.S. Geological Survey website:https://www.usgs.gov/products/maps/topo-maps Creating 3-D forms
|
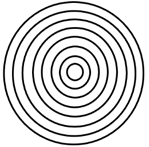 Look at these concentric rings. They look like the rings around a water droplet.
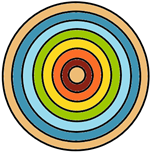
 the rings were a bird’s eye view of a water droplet or a child’s stacking toy. A
 scale on a map can help us interpret the topography.
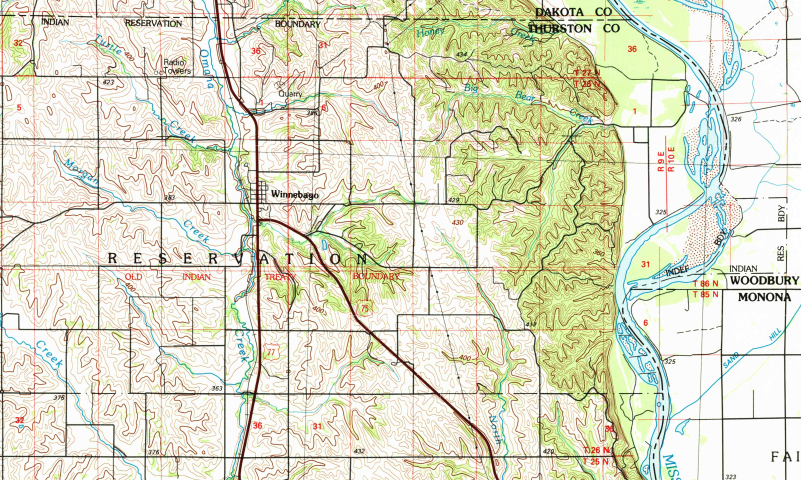 A topographic map is a 2-dimensional representation of Earth’s surface. The example above shows a USGS topographic map of the area around Winnebago, NE. The map combines political map boundaries, a road map, and contour lines. The solid black lines indicate roads. The rivers and creeks are shown in blue.
 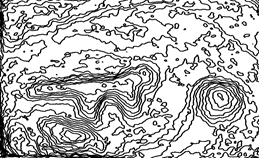 Contour lines of the surface of the sand
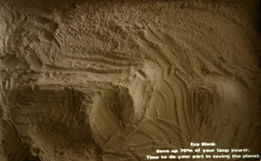 AR Sandbox without projection.
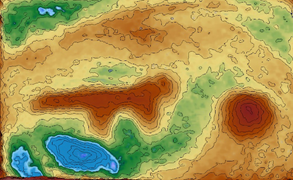 Color enhanced topographic map.
 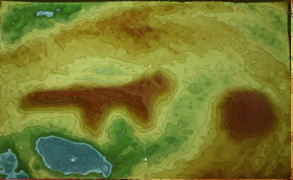 Projection of topographic map on sand.